Stock Market Analysis Report.
Introduction
In this report, we analyze and compare the performance of Apple, Microsoft, Netflix, and Google stocks over the past three months. The analysis includes examining trends, calculating moving averages, assessing volatility, and conducting correlation analysis to gain insights into the stock market dynamics.
Data Collection and Preprocessing.
We collected historical stock price data from Kaggle. and preprocessed the data to handle missing values and ensure data integrity.
Stock Price Movements.
We visualized the stock price movements for each company, identifying trends and patterns over the three-month period.
Apple Stocks Movements.
- Apple: Bullish continual pattern observed with consistent price increases.

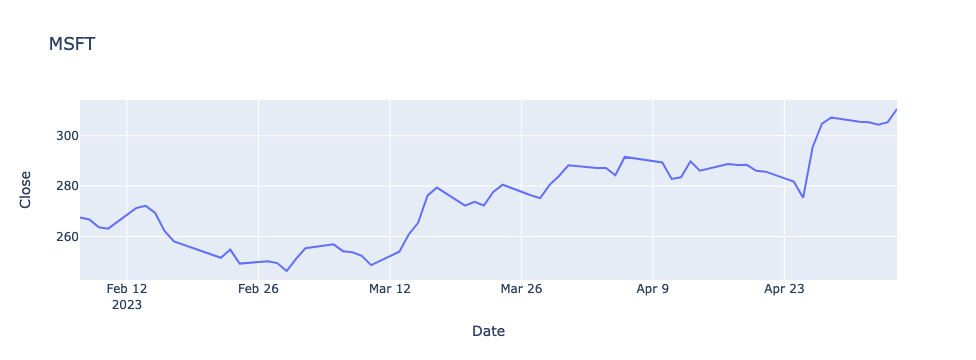
Microsoft Stocks Movements.
- Microsoft: Overall increasing trend with a brief period of decline at the beginning of the period.
Netflix Stocks Movements.
- Netflix: Initial decline followed by a sudden increase and subsequent decrease.
Google Stocks Movements.
- Google: Decreasing trend with a cup and handle pattern observed.
Moving Averages
Moving averages are commonly used in time series analysis to smooth out the data and identify trends or patterns. Moving averages (MA10, MA20, MA30) were calculated to smooth out short-term fluctuations and identify long-term trends in stock prices. The results were visualized to provide insights into the trend direction.

Volatility Analysis.
Volatility is the rate at which the price of a stock increases or decreases over a particular period. Higher stock price volatility often means higher risk and helps an investor to estimate the fluctuations that may happen in the future. We computed daily returns and analyzed the volatility of each stock. The findings indicated low volatility for the top tech companies, suggesting lower risk associated with investing in these stocks.
Daily Volatility
- AAPL 1.42%
- GOOG 2.07%
- MSFT 1.79%
- NFLX 2.25%
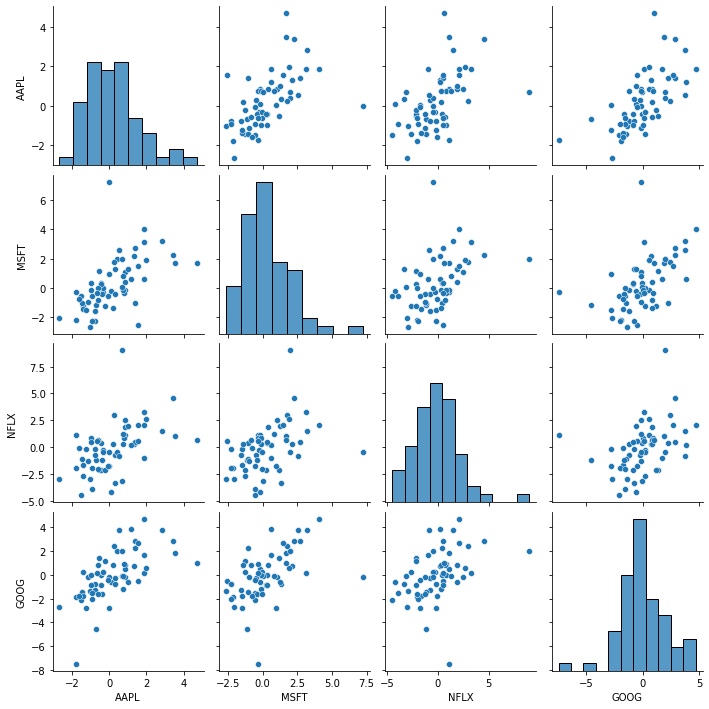
Correlation Analysis.
Correlation analysis was conducted to examine the relationships between the daily returns of different stocks. Positive associations were observed, with Netflix and Google showing a modest correlation and Apple and Google exhibiting a strong correlation.
Conclusion.
The analysis reveals valuable insights into the stock market performance of leading IT companies. Despite individual fluctuations, the stocks demonstrate overall positive trends and favorable correlations, indicating potential investment opportunities..


