 Project Title & Summary
Title: Credit Risk Analysis — Predicting Loan Defaults with Machine Learning
A machine learning project designed to identify borrowers at high risk of default using demographic and financial data. This solution enables smarter, risk-aware lending decisions through predictive modeling and Power BI dashboards for business insight.
 Files
Files
 Project Objectives
To build a classification model that can predict whether a borrower will default, and to create a business-friendly dashboard that highlights high-risk customer segments.
 Data Overview
- Source: Kaggle loan default dataset.
- Size: 32,581 rows, 12 columns.
- Features: person_age, person_income, person_home_ownership, person_emp_length, loan_intent, loan_grade, loan_amnt, loan_int_rate, loan_status, loan_percent_income, cb_person_default_on_file, cb_preson_cred_hist_length.
- Key columns: Include person_age, person_income, loan_amnt, loan_int_rate, loan_intent, and the target: loan_status.
 Data Cleaning & Exploration
- Detected and capped outliers in age and emp_length
- Filled missing emp_length with median
- Used regression to impute missing loan_int_rate
- Detected and dropped duplicates
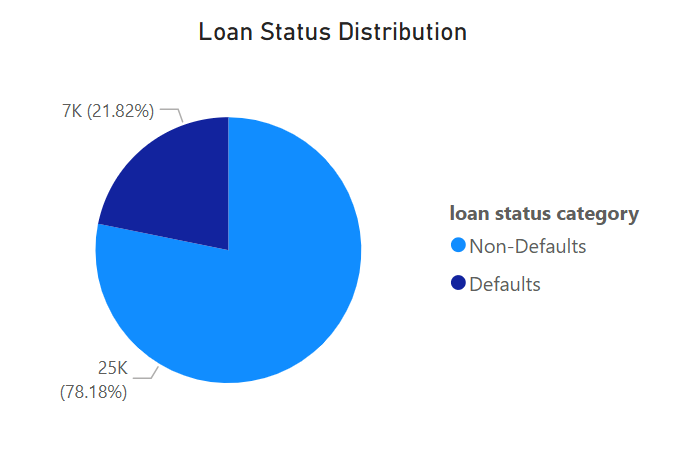
- Class imbalance observed in loan_status (many more paid than defaults)
 Feature Engineering
- One-hot encoding on categorical variables (e.g., loan_intent, education).
- Feature selection using LightGBM feature importance.
- Created dummy variables to support tree-based models.
Feature Relationships.
- Used Sklearn - Mutual information feature.
- No strong linear relationship between target and other features.
- person_income: (score = 0.114) Most informative! Income plays a big role in predicting default. The higher the income, the lower the chance of default.
- loan_int_rate: (score = 0.084) High interest rates correlate with increased risk. Possibly reflects lenders charging more to risky individuals.
- loan_percent_income: (score = 0.080) Borrowing a high % of one’s income = higher risk.
Target Distribution
Class imbalance detected
 Modeling
- Model Used: LightGBM Classifier
- Why LightGBM? Handles imbalance, fast training, interpretable
- Techniques Applied
- class_weight='balanced'
- Cross-validation (5-fold)
- Precision-recall threshold tuning to favor recall over precision
Goal: Minimize financial risk by catching as many defaulters as possible, even if some paying customers are flagged.
 Results
| Metric | Accuracy | AUC-ROC |
|---|---|---|
| Train Set | 93.50% | 97.42% |
| Test Set | 89.14% | 94.54% |
- Good generalization — minor overfit, acceptable
- Threshold tuning improved recall with controlled precision
 Business Insights Dashboard
Built in Power BI for the marketing team
Key Metrics
- Total Customers
- Dominant Age Group
- Most Common Loan Intent
- Average Income
- Overall Default Rate
- Average Loan Percent Income
Behavior & Affordability Visuals.
- Age Group vs Loan Percent Income (Mean): Highlights which age groups are taking loans that are a larger share of their income.
- Loan Amount by Age Group: Shows how much each group borrows. While not directly about risk, it gives insight into demand — useful for sizing up campaign efforts.
- Avg Loan Percent Income by Loan Status: Illustrates how the repayment burden (as a % of income) correlates with defaults — useful for messaging or prequalification criteria.
- Amount by Loan Intent: Reflects which loan purposes require higher funding. Again, helps guide the focus of targeted campaigns (e.g. more budget toward high-intent categories).
- Default Rate by Income Bracket: Tells us how income levels relate to default risk. If lower income = higher default, marketing might want to focus on more financially secure brackets — like how luxury brands target exclusive audiences.
 Key Learnings
- Handling real-world data messiness (missing values, outliers, imbalance)
- Precision vs Recall trade-off in business contexts
- End-to-end ML pipeline, from data cleaning to dashboard delivery
 Conclusion
- This project demonstrates the integration of machine learning and business intelligence to not only predict risk but inform business.
- The model performs well, the dashboard tells a story, and both are tools to empower decision-makers.